


In our last analysis regarding Ethereum, I warned traders that a bearish formation of a bearish flag was spotted and a break below $440 would give a new bearish signal. The price got rejected at the Ichimoku cloud resistance and broke the flag downwards.
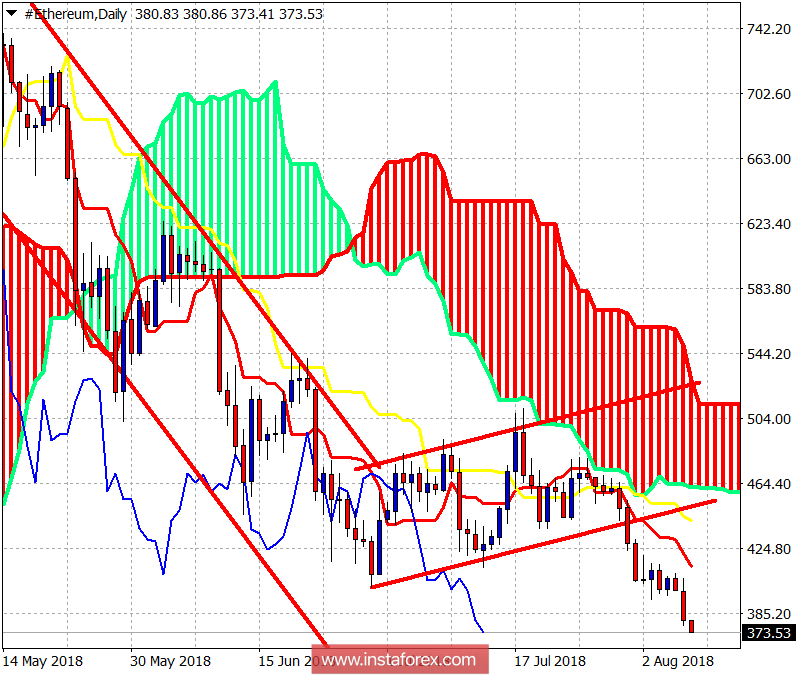
The trend remains bearish. The price must break above $425 in order for the short-term trend to change to bullish. A daily trend will change to bullish on a break above $513. Next support is at $365-350 at the April lows. Breaking below the April lows can push Ethereum lower towards $200-180 price level.


