


EUR/USD remains in a bearish trend as the price is below the Ichimoku cloud. Price has started a bounce from Monday when it made a low at 1.1529 just above the major horizontal support at 1.15. Price is making higher highs and higher lows. However medium-term trend remains bearish as long as the price is below 1.17.
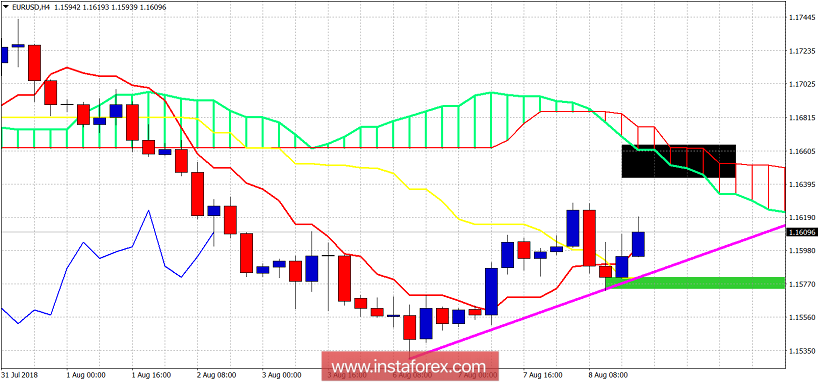
Magenta line - trend line support
Green rectangle - support area
The EUR/USD has short-term support at 1.1580-1.1570. As long as the price is above this level we could see the pair move towards the cloud resistance and the black rectangle target at 1.1640-1.1660. A break above the cloud would be a bullish sign but not confirmation of a bigger trend change. At the 1.1660-1.1670 area, we find the Daily Kumo (cloud) resistance. Bulls need at least a daily close above this level to hope for a bigger trend change.


