


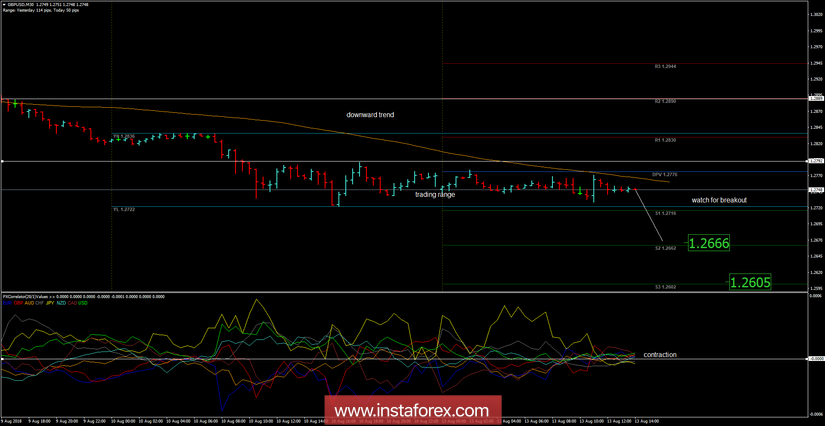
Recently, the GBP/USD pair has been trading sideways at the price of 1.2750. According to the M30 time – frame, I found that price is trading inside of the trading range between the price of 1.2790 (resistance) and the price of 1.2722 (support). I also found that price is trading below the pivot level and that GBP/USD is following a downward trajectory, which is a sign that you should watch for selling opportunities if you see a valid breakout of support. The downward targets are set at the price of 1.2666 and at the price of 1.2605.
Resistance levels:
R1: 1.2830
R2: 1.2890
R3: 1.2945
Support levels:
S1: 1.2715
S2: 1.2662
S3: 1.2605
Trading recommendations for today: watch for potential selling opportunities.


