


Gold price has overshot below the lower wedge boundary and is forming a bullish reversal candle. Gold price moved as low as $1,160 area providing a better-than-expected sell profit from our yesterday intraday short idea once $1,193 was broken downwards.
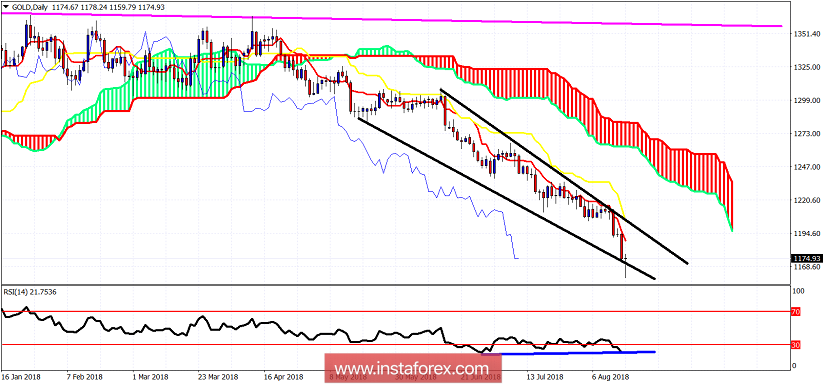
Blue line - Bullish divergence
Magenta line - long-term resistance
Gold price remains in a bearish trend. Price is below both the tenkan- and kijun-sen (red and yellow lines) indicators. Price remains inside the wedge pattern even if we have seen an overshoot earlier this morning. Price is forming a bullish hammer (reversal pattern) but we need to be patient to see at the end of the day how this will have been formed. Resistance at $1,211 is key for the short-term trend. We could see a bounce towards the upper wedge boundary or at least towards the tenkan-sen at $1,190-93.


