


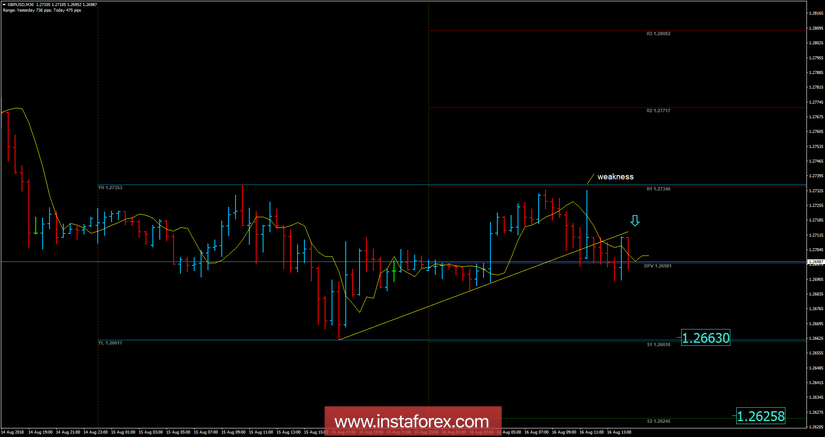
Recently, the GBP/USD pair has been trading sideways at the price of 1.2697. According to the M30 time – frame, I found a buying climax in the background (weakness) and lack of buying power since the price didn't test the resistance 1. I also found a broken upward trendline in the background, which is another sign of weakness. My advice is to watch for potential selling opportunities. The downward targets are set at the price of 1.2663 and at the price of 1.2625.
Resistance levels:
R1: 1.2734
R2: 1.2771
R3: 1.2808
Support levels:
S1: 1.2663
S2: 1.2625
S3: 1.2587
Trading recommendations for today: watch for potential selling opportunities.


