


Gold price has broken short-term resistance and could give us a short-term bounce towards $1,190-$1,200 as long as the price is above $1,170. Trend remains bearish as long as the price is below $1,210.
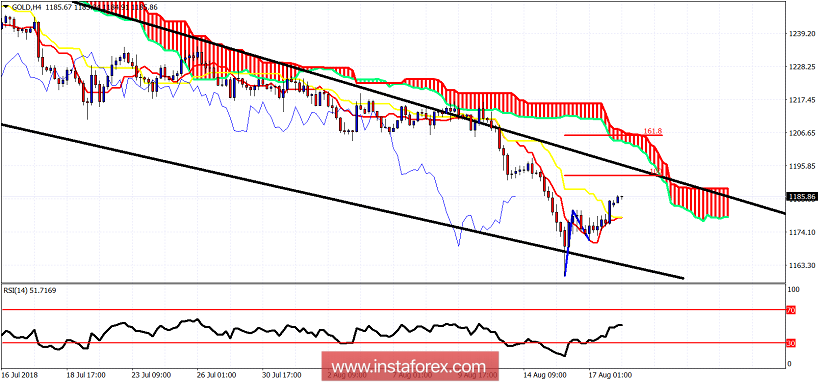
Gold price remains below the Ichimoku cloud and inside the wedge pattern. As long as both of these conditions hold, trend will remain bearish. Important trend resistance is at the upper wedge boundary and at the cloud resistance of the $1,195-$1,210 area. Gold price has started making higher highs and higher lows since last week's sell off and reversal we noted. Gold price is expected to continue its bounce towards $1,200. It is too early to tell if an important low is in, but we will have to keep a close eye on USD/CNY for more clues as the correlation between this pair and gold is very close the last few months.


