


EUR/USD is trading below 1.16 but the pullback has not been as strong as the previous declines. EUR/USD has broken above the Ichimoku cloud in the short-term and as long as price holds above 1.15 bulls have hopes of turning the trend in their favor.
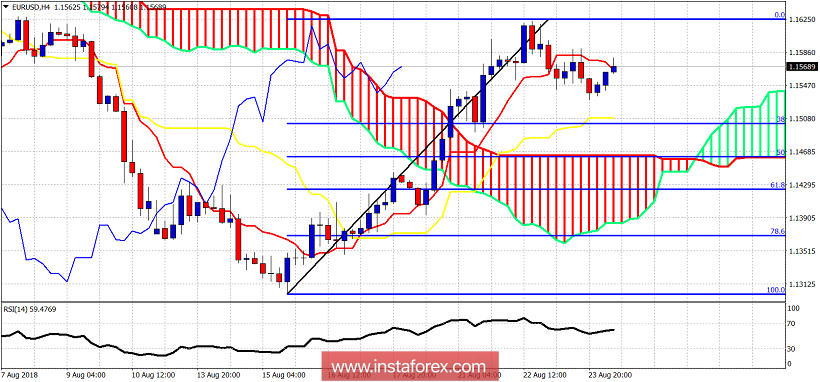
Support is found at 1.15 where we find the 38% Fibonacci retracement, the 4-hour kijun-sen (yellow line indicator) and the previous horizontal support breakdown level. Next support is at 1.1470 where we find the 4 hour Kumo (cloud). Resistance is at 1.1630. Breaking above this level will most probably push EUR/USD above 1.17.
If price pulls back lower towards 1.15-1.1470 and support is held, I would look to enter long positions in EUR/USD and would add to longs on a break above 1.1670 where the next major resistance is found.


