


Gold price broke and closed the week above $1,200. Trend is bullish. Gold price made a shallow pull back as expected at the 38% Fibonacci retracement and then broke higher to new highs. Gold price is expected to continue higher but could first see a back test of $1,200.
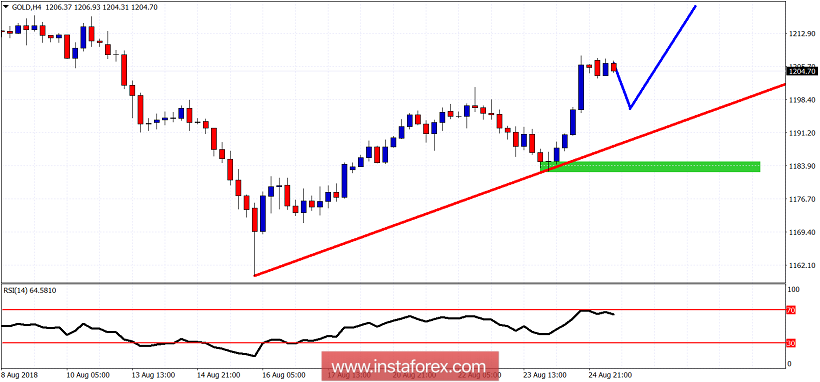
Red line - support trend line
Green rectangle - bulls line in the sand support
Blue lines - expected path
Gold price has major support at $1,182 and for the trend to remain bullish we need to stay above this level. The first warning for bulls will come if price breaks below the red trend line support at $1.190. Bulls would ideally want to see another shallow pull back and back test of $1,200 and then a break higher. Short-term target remains at $1,220 given from our previous analysis.


