


EUR/USD has reached the 1.1730 previous resistance area and pulled back as expected. Although trend remains bullish as the price remains inside a bullish channel, we warned yesterday that the RSI was giving bearish divergence signs and that a pullback should be expected.
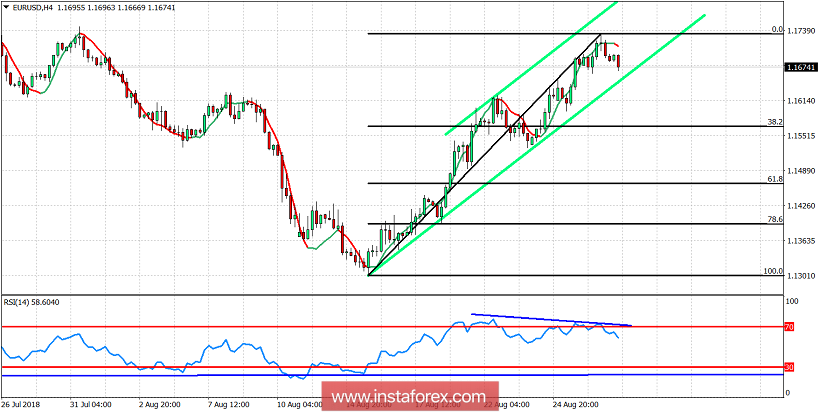
Blue line - bearish divergence
EUR/USD has short-term support at 1.1650 at the lower channel boundary. If this level is broken, we should expect the prices to continue lower towards 1.1570 where we find the 38% Fibonacci retracement of the entire rise from 1.13. If this level is broken too, we should then expect EUR/USD to fall as far as the 61.8% Fibonacci retracement which is the next important support. Another break above 1.1730 will be a very bullish sign specially if accompanied by a new RSI high in the 4 hour chart. This will increase dramatically the chances that low at 1.13 is a major low. If however, the price makes new high with bearish RSI divergence, bulls should be very cautious as the market will be preparing for a deeper pullback.


