


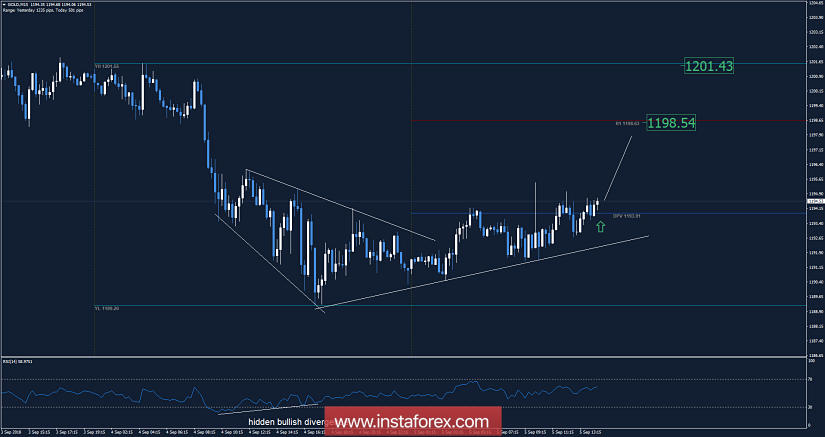
Recently, Gold has been trading sideways at the price of $1,194.00. According to the M15 time – frame, I found a rising upward trendline, which is a sign that intraday buyers are in control. The price also broke the daily pivot ($1,193.90). I found a hidden bullish divergence on the RSI (14) oscillator, which is another sign of strength in the background. Watch for selling opportunities. The upward targets are set at the price of $1,198.55 and at the price of $1,201.45.
Resistance levels:
R1: $1,198.63
R2: $1,206.26
R3: $1,210.98
Support levels:
S1: $1,186.28
S2: $1,181.55
S3: $1,173.95
Trading recommendations for today: watch for potential buying opportunities.


