


EUR/USD has moved back above 1.16-1.1620 towards major short-term resistance at 1.1660 but sellers appeared once again and are putting pressure on the pair. Another rejection at 1.1660 is not a bullish sign. On the other hand, as long as bulls respect and defend the 1.1540 neckline support they are safe. A break below the neckline will activate the Head and Shoulders pattern.
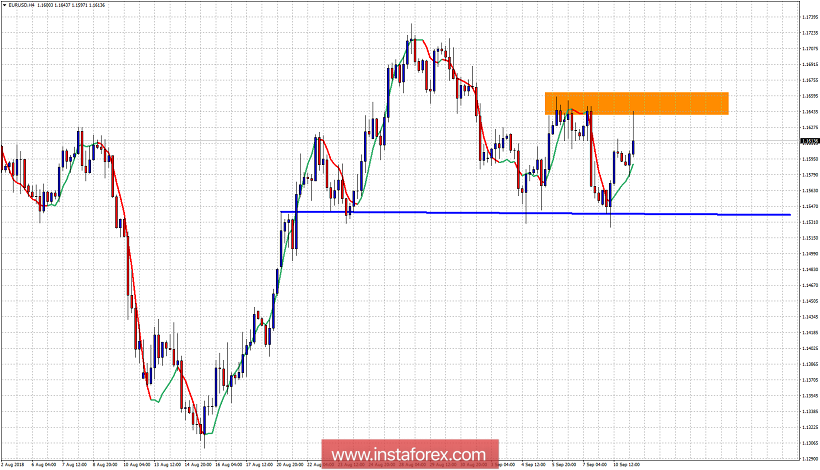
Orange rectangle - resistance area
Blue horizontal line - neckline support
EUR/USD has reached 1.1644 only to get rejected. So far the 4 hour candle is bearish with a long upper tail. If bulls manage to break above the recent high it will be a bullish sign that will increase the chances of challenging and breaking above the 1.1660 resistance. Support is at 1.1590. A 4-hour close below this area will be a sign of weakness, implying a move towards the neckline support at 1.1540 is coming.


