


Gold price tried to push move higher but price only managed to make a lower high at $1,206. A break above this level will be a bullish signal that will most probably bring price to the short-term resistance of $1,210-11. A break above this level will push Gold towards $1,220.
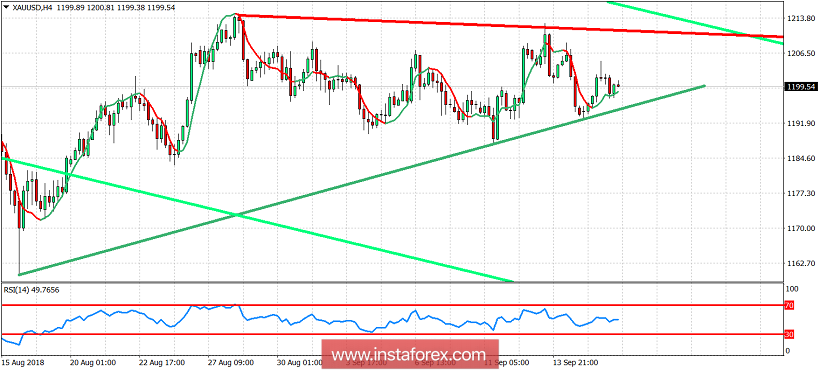
Green upward sloping trend line - support
Light green lines - bearish channel
Red line - short-term resistance
Gold price continues to respect the green upward sloping support trend line. As long as we are above $1,190 I expect prices to continue higher towards $1,220. Short-term key resistance at $1,206-10 area if broken will give the bullish signal. A break below $1,190 will most probably push price towards $1,170 and lower.


