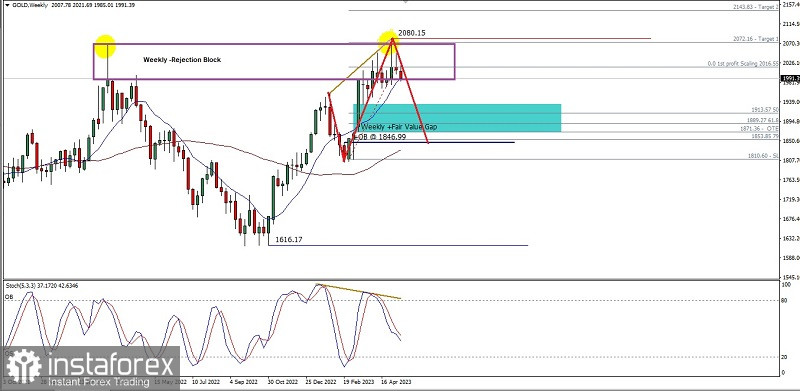
Even though on the weekly chart the gold commodity asset is still moving in a bullish condition marked by the MA 10 Golden Cross above the MA 39 but after successfully breaking above the Old High level of 2069.90 and forming a Double Top pattern (yellow circle), Gold is currently likely to be corrected down where this has also been confirmed by the emergence of deviations between price movements and the Stochastic Oscillator indicator so that in the next few weeks Gold has the potential to fall down to test the level of the 1913.50 - 1846.99 area but if on the way down Gold suddenly moves back to its initial bias (Bull) ) and breaks above the level of 2080.15 then all the downside scenarios described earlier will become invalid and cancel automatically.
(Disclaimer)


