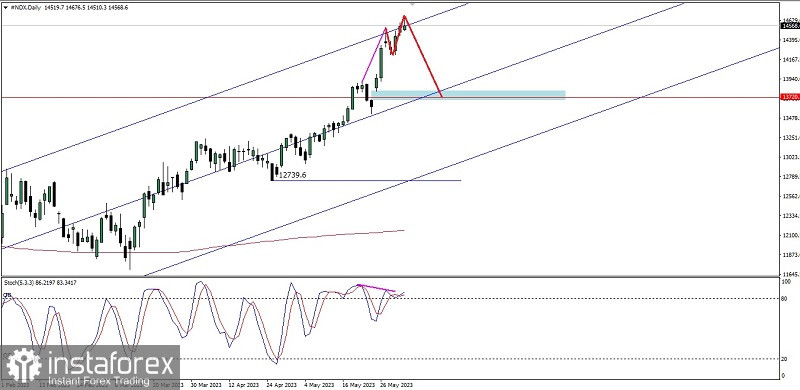
On the daily chart, the Nasdaq 100 index shows a deviation between the price movement and the Stochastic Oscillator indicator, even though the bias condition of #NDX is still in a Bull condition, which is confirmed by the price movement which is moving in a channel that is going upwards but is currently in an Overbought condition, where currently the price is stuck at the upper line of its weekly Pitchfork channel and the Stochastic Oscillator indicator is at level 80 (Overbought) so based on the above facts in the next few days it seems that as long as there is no continuity upward movement which exceeds the 14676.5 level then #NDX still has potential plunge down to the level area 13794.3-13695.5.
(Disclaimer)


