


Gold price continues to move sideways below the $1,240 resistance. Price remains inside a bullish channel and a break above $1,233 would be the bullish signal we expect for a move towards $1,260-70.
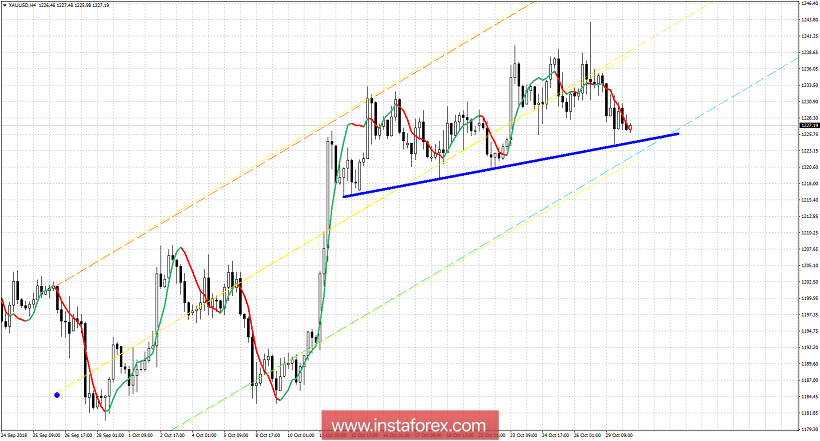
Parallel lines - bullish channel
Blue line - short-term support trend line
Gold price so far respects support levels. Any attempt to break above $1,238 has failed. So far Gold price has tried it three times. There will not be a fourth. Gold price will either move lower from current levels or it will break upwards towards $1,260. Next time we see a break above $1,238 it will be for real. Gold would then move towards $1,260. Support is at $1,220-23. We do not want to see this level broken if we are long. I believe the most probable scenario is to see Gold eventually break to the upside.


