


Overview:
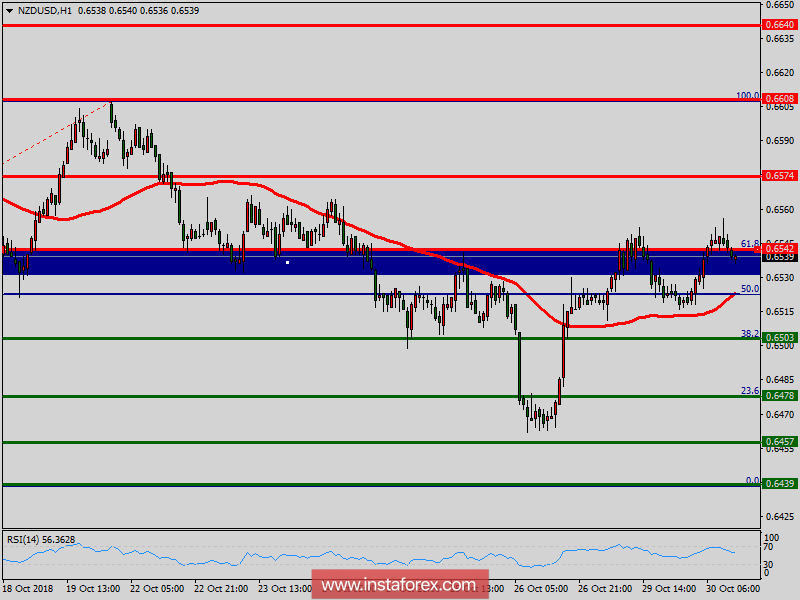
The NZD/USD pair fell from the level of 0.6542 towards 0.6503. Now, the price is set at 0.6539. On the H1 chart, the resistance of USD/CHF pair is seen at the level of 0.6542 and 0.6574. It should be noted that volatility is very high for that the NZD/USD pair is still moving between 0.6542 and 0.6478 in coming hours. Moreover, the price spot of 0.6542 remains a significant resistance zone. Therefore, there is a possibility that the NZD/USD pair will move downside and the structure of a fall does not look corrective. In order to indicate the bearish opportunity below 0.6542, sell below 0.6542 with the first target at 0.6503 in order to test yesterday's bottom. Additionally, if the NZD/USD pair is able to break out the bottom at 0.6503, the market will decline further to 0.6478 in order to test the weekly support 2. Also, it should be noticed that support 3 is seen at the level of 0.6439 which coincides the double bottom at the same time frame.


