


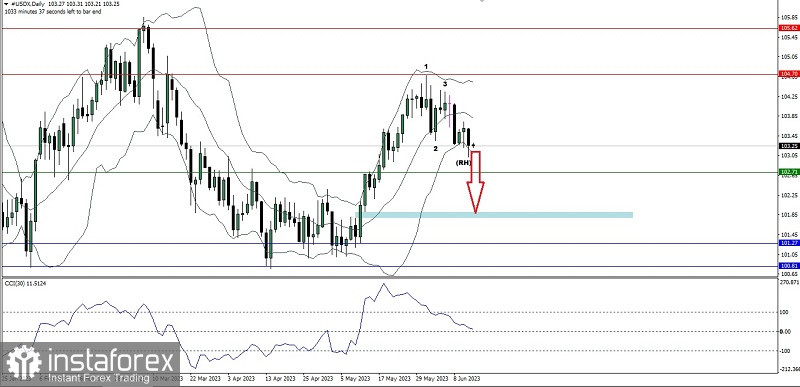
On the daily chart of the United States Dollar Index, you can see the appearance of a Bearish 123 pattern followed by a Bearish Ross Hook (RH) where currently USDX is trying to break below the 103.02 level. If it is successfully broken, then USDX will find a significant support level at 102.71 which has been confirmed. by CCI (30) which is heading to level 0, but if it is successfully broken it is not impossible for USDX to continue its depreciation to the level of the Bullish Fair Value Gap area at the level of the 101.91-101.78 area with a note that during the way down there was no upward correction that exceeded the level 104.10 because if this level is broken above then all the downward scenarios previously described will become invalid and cancel automatically.
(Disclaimer)


