


Gold price challenged the recent highs once again yesterday but got rejected once again. Price pulled back towards its recent lows and the 61.8% Fibonacci retracement support. Price holds above short-term support. No clear trend in the short-term yet. Price moves sideways between $1,236-$1,220.
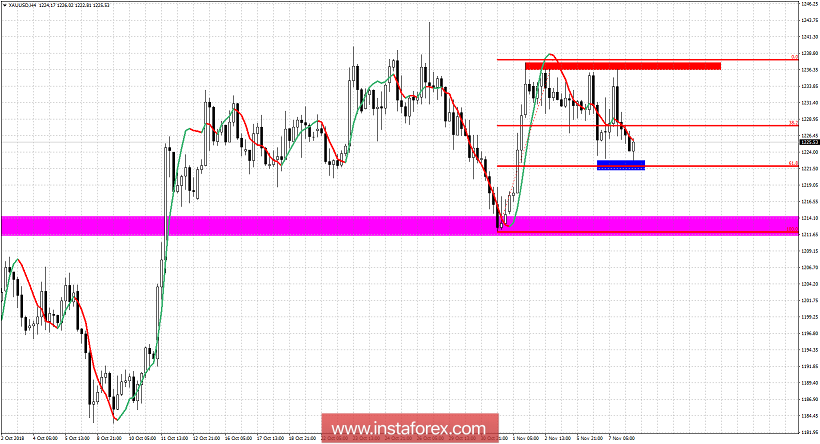
Blue rectangle- short-term support
Red rectangle - short-term resistance
Gold price has been moving the last two days between the two short-term important levels. As long as we trade above $1,212 I remain optimistic. Breaking above $1,240 is what Gold bulls need to see in order to see a rally towards $1,260 and higher. The resistance at $1,235-40 is confirmed several times. Bulls do not want to move far from it and specially not break below $1,212. Bears on the other hand want to see price break to new lows and confirm the rejection at $1,240 on a weekly basis. This will be a bearish sign and would target Gold towards $1,100 or lower.


