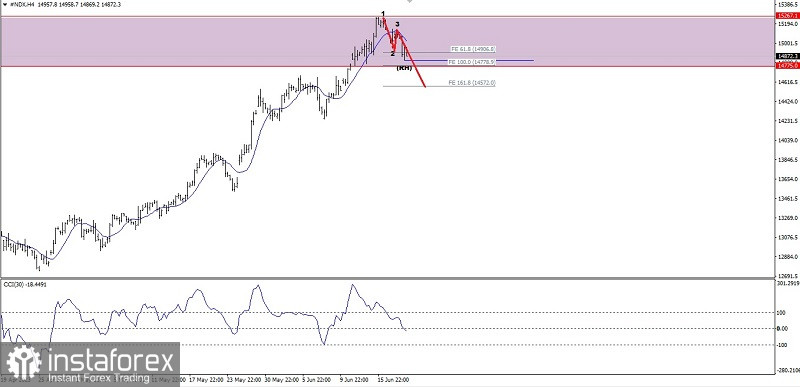
If we look at the 4-hour chart, the Nasdaq 100 index appears to be stuck in the Resistance area at 15267.1-14775.0 and the appearance of the Bearish 123 pattern followed by Bearish Ross Hook indicates that in the near future #NDX is being bullish due to being stuck in the Resistance area will experience a downward correction to the level 14778.9 as the main target and the level 14572.0 as the second target, however all of this will become invalid and cancel by itself if on the way to these levels suddenly #NDX returns to its initial bias especially if managed to break above the level of 15139.1.
(Disclaimer)


