


Gold price is bouncing as expected. Price remains below the major resistance at $1,243.50 and is challenging important Fibonacci resistance levels. Gold price will need to break above $1,243.50 for bulls to regain control of the trend. Until then, they are in danger and prices could fall below recent lows.
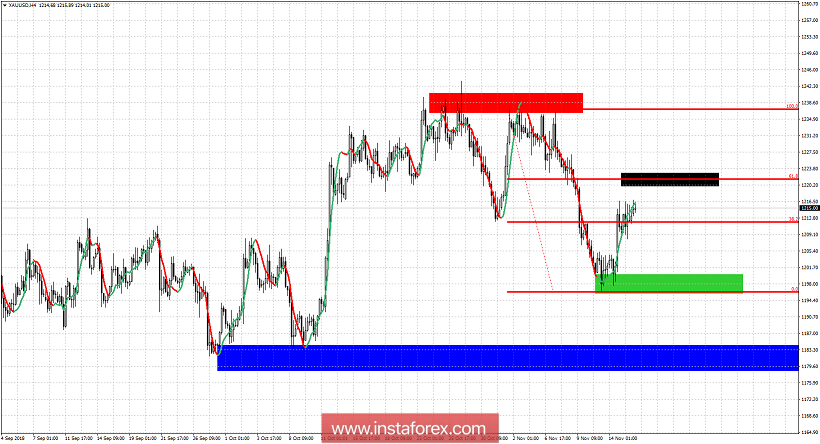
Red rectangle - major resistance
Blue rectangle - major support
Green rectangle- short-term support
Black rectangle - short-term resistance
Gold price has broken above the 38% Fibonacci retracement resistance. Now it is expected to challenge the black rectangle area and the 61.8% Fibonacci retracement. A rejection at that area is expected. If price however manages to break above it and stay above, then we will have a small win for bulls. But only if the major resistance at $1,243.50 breaks, will bulls control the trend again. Until the they are vulnerable. Support is at also at $1,196 and if broken any chances for breaking above $1,243.50 will be minimized. My first target area is at the blue rectangle. I consider this bounce as a selling opportunity with stops at recent highs.


