


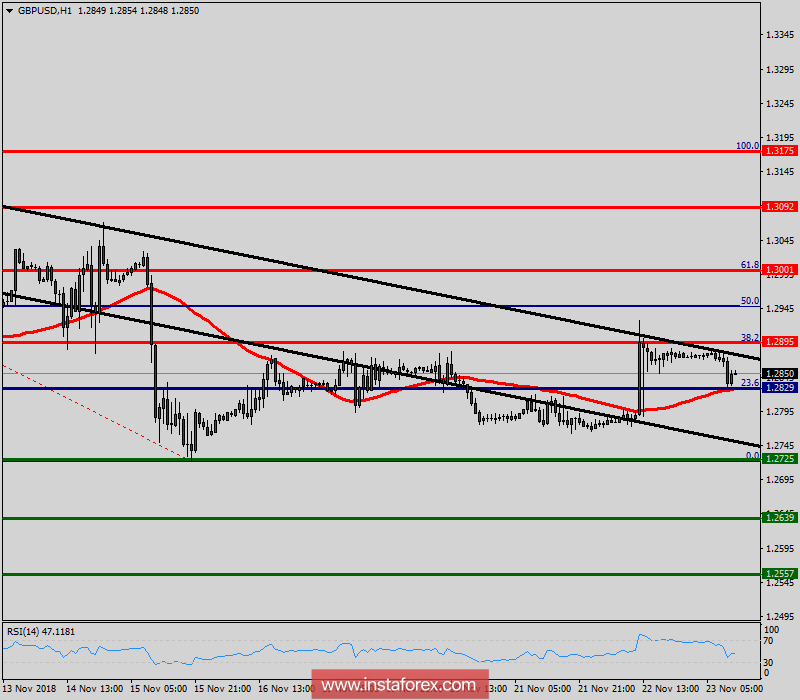
The GBP/USD pair dropped sharply from the level of 1.2890 towards 1.2780. Now, the price is set at 1.2850.
On the H1 chart, the resistance is seen at the levels of 1.2890 and 1.3001. Volatility is very high for that the GBP/USD pair is still expected to be moving between 1.2829 and 1.2725 in coming hours. In the short term, we expect the GBP/USD pair to continue to trade in a bullish trend from the new support level of 1.2725 to form a bullish channel. Also, it should be noted that major resistance is seen at 1.2829, while immediate resistance is found at 1.2829.
According to the previous events, the pair is likely to move from 1.2725 towards 1.2829 and 1.2890 as targets.
In the H4 time frame: However, if the pair fails to pass through the level of 1.2890, the market will indicate a bearish opportunity below the level of 1.2890. So, the market will decline further to 1.2725 in order to return to the daily support.
Moreover, a breakout of that target will move the pair further downwards to 1.2639.


