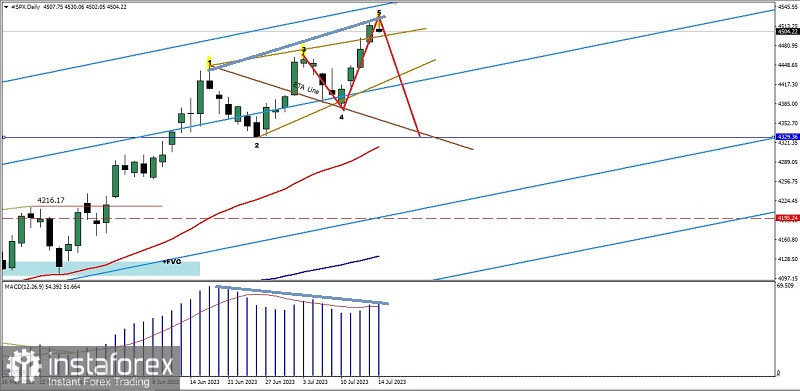
On the daily chart the S&P 500 index, although the bias condition as a whole is still in a bull condition, this is confirmed by the 50 & 200 EMA, which is still the Golden Cross and the price is moving in the channel, which is swooping upwards, but some interesting facts appear as follows. :
1. There is a Bearish 3 Little Indian pattern.
2. There is a Bearish Wolves Pattern.
3. The emergence of deviations between the MACD indicator and price movements.
4. There is a bearish Pinbar Candle pattern.
Through the three facts above, in the next few days the S&P 500 index has the potential to be corrected down for the next few days where 4379.95 and/or the ETA Line from Wolve Waves will be the main goal of #SPX and if this level is successfully broken down then the next level will be 4329.36. is the next target that the S&P 500 index will try to test, but if on its way to these target levels suddenly the #SPX returns to its initial bias and breaks above the 4530.06 level, then all of the downward correction scenarios described earlier will become invalid and automatically cancel by itself.
(Disclaimer)


