


Gold price reached the recent highs around $1,230 again yesterday but was unable to break above resistance yet. Price is now pulling back once again confirming the importance of the short-term resistance area at $1,230.
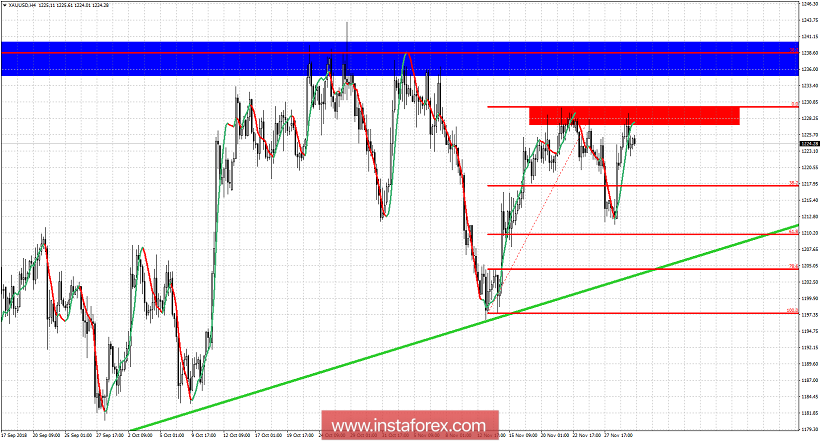
Red rectangle - important short-term resistance
Green line - major trend line support
Gold price held the 61.8% Fibonacci retracement level and did not break below the green trend line support. These are two very important bullish signs. Not only that, but prices bounced strongly back towards last weeks highs at $1,230. Breaking above this resistance will be an important bullish sign for more upside. Target will then be a move to $1,250-60 at least. Major support area is now at $1,211-$1204. Breaking below this week's lows will be a bearish sign. Breaking below the green trend line support would increase the chances for a move much lower than $1,180. For now bulls keep the upper hand and as long as $1,203 holds.


