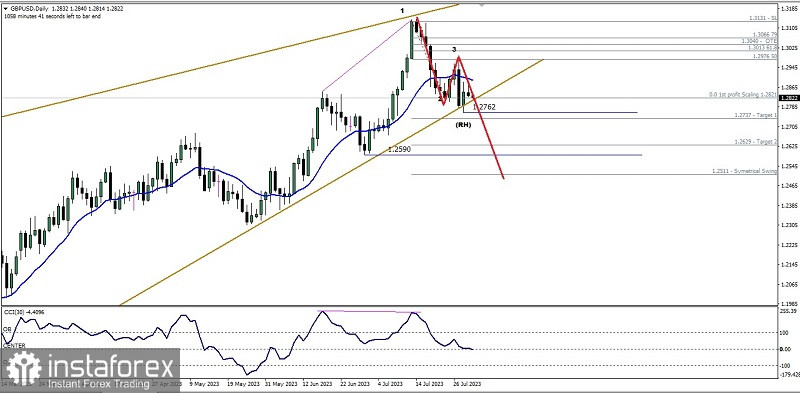
If we look on its 4 hour chart of GBP/USD main currency pair, we can find a few interesting facts below:
1. The appearance of Bearish 1233 pattern followed by the appearance of Bearish Ross Hook (RH).
2. The appearance of deviation between price movement with CCI indicator.
3. There is a Rising Wedge pattern.
Based on these facts, Cable in the next few days has the potential to weaken down to the 1.2762 level which is also a Ross Hook where if this level is successfully broken down then GBP/USD has the potential to go to the 1.2629 level as the main target and the 1.2511 level as the next target if the momentum and volatility is quite good but all of these downside scenarios may become invalid if on the way down suddenly the GBP/USD both goes up again and breaks above the 1.3000 level.
(Disclaimer)


