


Gold price continues to trade inside the triangle pattern. In our previous posts, we have mentioned the price levels we should keep in focus and both the upside and downside targets depending on the direction of the break out.
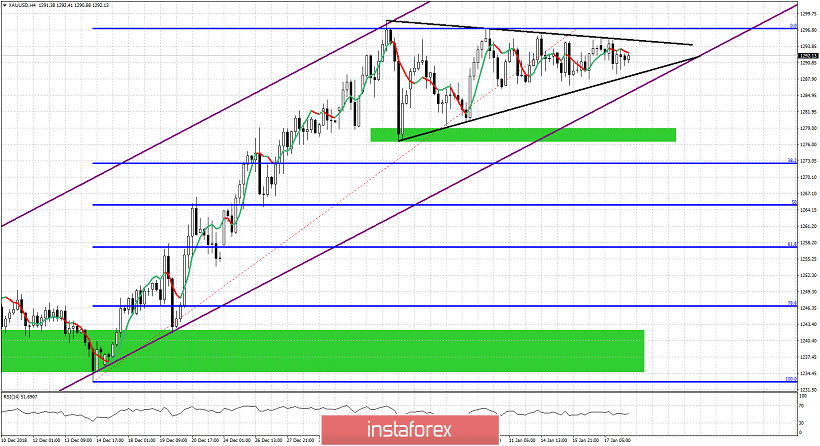
Purple lines - bullish channel
Black lines - triangle pattern
My preferred view and most probable scenario is that we are going to make an upward break out because the trend so far has been bearish and this triangle pattern is more like a consolidation/pause phase before we continue the prevailing medium-term trend. Price remains inside the bullish channel and this is another sign supporting the bullish scenario. However we should not forget that triangles are usually found near the end of the trend. Most usually before the final wave of the trend. Saying that I believe that the most probable scenario is for an upward breakout targeting $1,310-20 and then a deep pull back towards $1,280-60. Price is running out of space in the triangle pattern. So very soon we will know which direction we will follow.


