


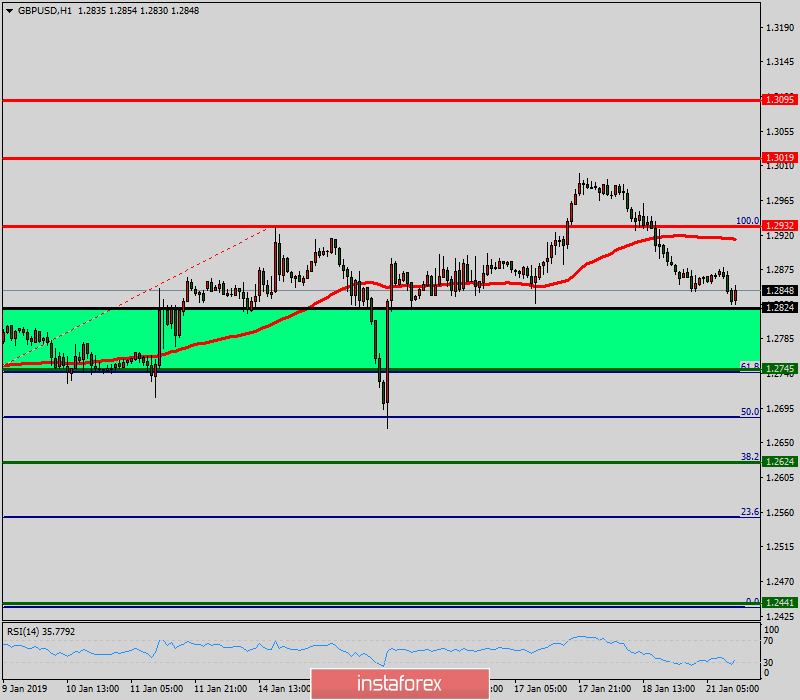
The GBP/USD pair will continue rising from the level of 1.2824 which represents the daily pivot point on the H1 chart in the long term. It should be noted that the support is established at the level of 1.2745. The price is likely to form a double bottom in the same time frame. Accordingly, the GBP/USD pair is showing signs of strength following a breakout of the highest level of 1.2824. So, buy above the level of 1.2824 with the first target at 1.2932 in order to test the daily resistance 1. The level of 1.3019 is a good place to take profits. Moreover, the RSI is still signaling that the trend is upward as it remains strong above the moving average (100). This suggests that the pair will probably go up in coming hours. If the trend is able to break the level of 1.2932, then the market will call for a strong bullish market towards the objective of 1.3019 today. On the other hand, in case a reversal takes place and the GBP/USD pair breaks through the support level of 1.2745, a further decline to 1.2624 can occur. It would indicate a bearish market.


