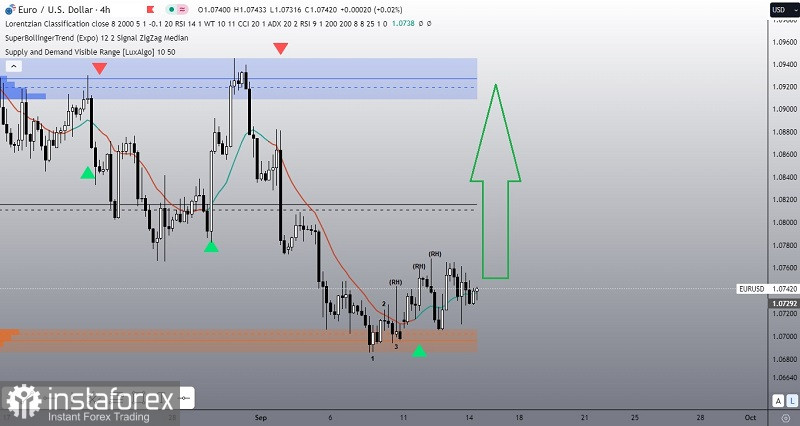
If we look on the 4 hour chart of EUR/USD main currency pairs, there is the price movement which is stick on its Demand/Support level area (Orange Box) which is by any chance also appears the Bullish 123 pattern followed by Ross Hook as well as followed by the appearance of BUY signal arrow from SuperBollingerTrend indicator as well as kernels from AI Lorentzian Classification indicator colored in green + diving upwards. All of this shows that in the near future Fiber has the potential to appreciate upwards to test the last Ross Hook level of 1.0678 and if this level is successfully broke upwards and there is no downward correction which is significant enough to broke below the level of 1.0686 then EUR/USD has the potential to continue the rally up to level 1.0816 as the first target and if momentum and volatility support then level 1.0922 will be the second target.
(Disclaimer)


