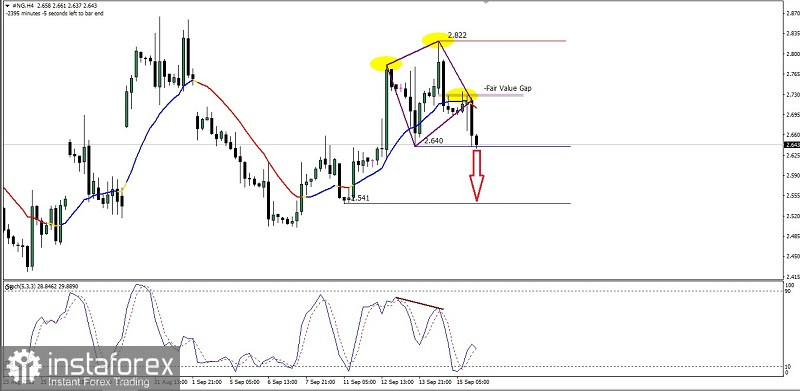
Apart from the appearance of deviations between price movements and the Stochastic Oscillator indicator as well as the price movement is below the WMA (20) which also has a decreasing slope, this all indicates that in the future Natural Gas on the 4-hour chart has the potential to weaken, which is also confirmed by the appearance of the Bearish Diamond pattern (maroon diamond) / Head & Shoulder (yellow circle) which is a Bearish Reversal pattern so that in the near future #NG has the potential to test level 2,640 if this level is successfully broken downwards and during the downward journey there is no upward retrace that exceeds level 2,790 then #NG has the opportunity to continue its weakening in the near future to the level of 2,541.
(Disclaimer)


