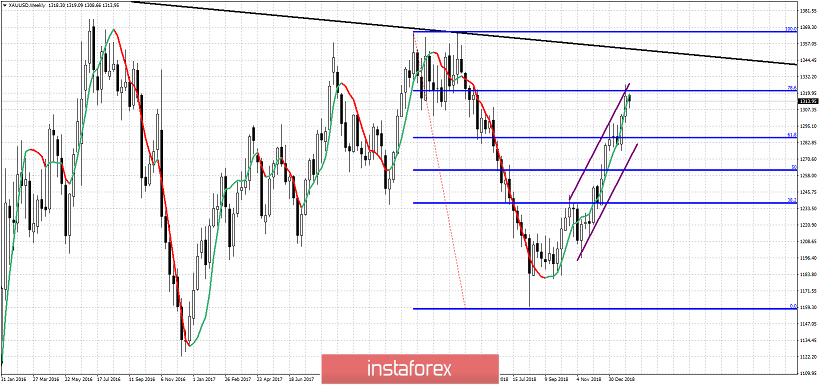
Today we take a look at the weekly chart of Gold as yesterday's price movement has not provided any new information regarding the short-term trend. Trend remains bullish but below important Fibonacci and long-term resistance levels. This is a very important resistance area all the way to $1,350. A rejection here could be catastrophic for Gold prices.

Black line - long-term resistance trend line
Gold price has made a strong bounce since August and has reached the 78.6% Fibonacci retracement level of the entire decline from $1,366. This is important Fibonacci level resistance. Price has stopped the rise here but there is no sign of reversal yet. Trend remains bullish as long as price is above $1,300 and we could even see a test of the long-term black trend line resistance around $1,350. However at least a back test towards $1,300 should be seen first before any big move higher.


