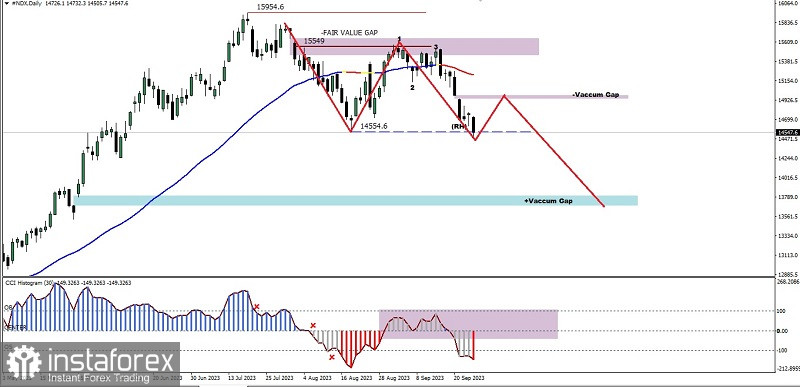
With its price movement which move below the Moving Average, as well as CCI indicator which manages to broke below its main 3 level (100, 0, -100) and now stuck on the level area of 100 & 0, where this indicates that there is still Resistance and the ongoing bearish movement in the index, based on these two facts, it can be seen that Sellers are still dominating #NDX so that in the next few days, even if there is an upward retrace to test the Bearish Vacuum Gap (Pink) area and as long as it does not breaks above level 15262.5, #NDX will continued its decline to the Bullish Vacuum Gap area at the 13794.3-13695.5 area.
(Disclaimer)


