Technical market overview:
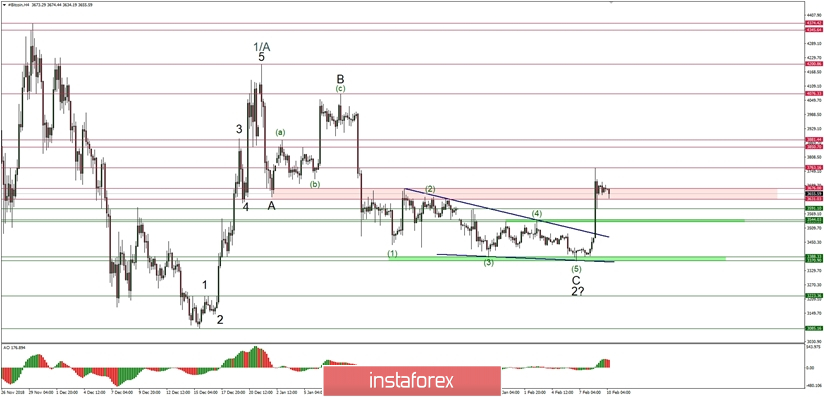
The BTC/USD price had spiked through the short-term trend line resistance around the level of $3,500, so the bearish Elliott Wave scenario was invalidated and the count was updated as well. The current scenario indicates a termination of the ABC correction at the level of $3,386 and an impulsive wave continuation to the upside.
The local high was made well above the key technical resistance zone located between the levels of $3,631 - $3,676 as the big up candle spiked at the level of $3,767. Currently, the market is testing this zone after a local low was made at the level of $3,591. There is still one untested technical support level, located at $3,544, so traders should be aware of this zone and the possibility that it will get tested from above before the up move will continue.
Weekly Pivot Points:
WR3 - $4,242
WR2 - $4,002
WR1 - $3,885
Weekly Pivot - $3,610
WS1 - $3,455
WS2 - $3,290
WS3 - $3,068
Trading recommendations:
After the spike up the traders should try to buy the BTC at one of the buyback zones: $3,544 - $3,533, or $3,591 with a solid protective stop-loss order. The targets should be placed at the level of $3,767 or even above as the impulsive wave progression will unfold.


