Technical market overview:
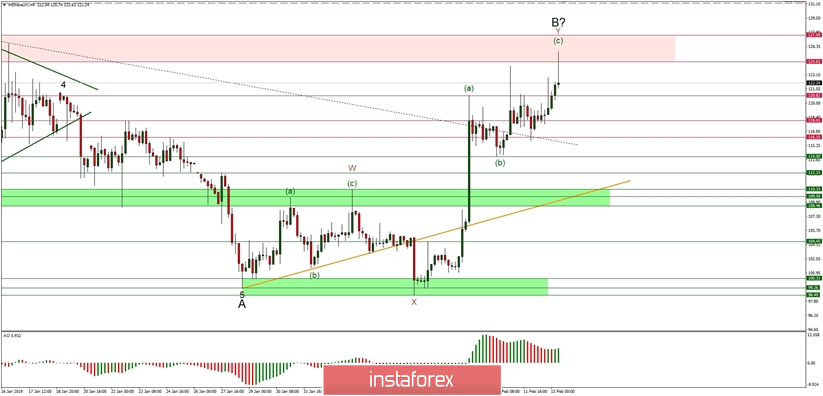
The ETH/USD pair has spiked up towards the resistance zone located between the levels of 124.61 - 127.59, but the price reversed quickly and made a Shooting Star candlestick pattern so far. This kind of price action is the first warning that the current uptrend might be reversing. The second warning comes from the Elliott Wave theory perspective in which the recent up move might be a corrective wave (c) move, so it is about to complete as well. The third warning is the clear and visible bearish divergence between the price and the momentum indicator at the current levels around the 122 USD.
Please notice the bearish divergence between the price and the momentum indicator that support the short-term bearish outlook. The nearest technical support is seen at the level of 114 USD and 112.15 USD.
Weekly Pivot Points:
WR3 - 149.94
WR2 - 135.39
WR1 - 127.42
Weekly Pivot - 112.16
WS1 - 105.12
WS2 - 90.45
WS3 - 82.23
Trading recommendations:
No buy orders should be opened at the current price levels. Only the sell orders should be opened as close as possible to the level of 120.81 - 124.10 with a protective stop loss placed above the level of 127.59 The target is technical support at the level of 112.15 and 110.33.


