


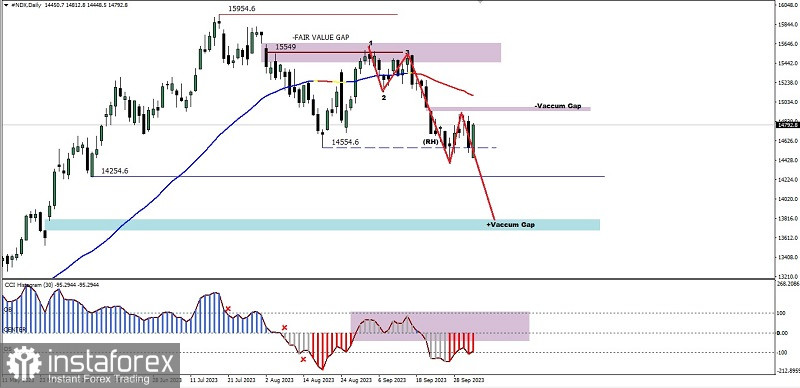
From the daily chart, it is clear that Nasdaq 100 Index still inside the Bearish condition where this can be seen from the price movement which is moving below the Moving Average and the CCI indicator is still in a Bearish pattern and the presence of a Bearish 123 pattern followed by a bearish Ross Hook gives an indication that in the next few days #NDX has the potential to continue its weakening to level 14254.6 as the main target and The level of the Bullish Vaccuum Block area is the second target, but if on its way to these targets suddenly #NDX is corrected upwards until it breaks above the level 1562.5, then all the decline scenarios that have been described previously will become invalid and automatically cancel themselves.
(Disclaimer)


