


Gold price has hit all our short-term targets after breaking above $1,317 when our last bullish signal was given. Price has reached the upper channel boundary and at $1,340 I prefer to take profits and stay neutral.
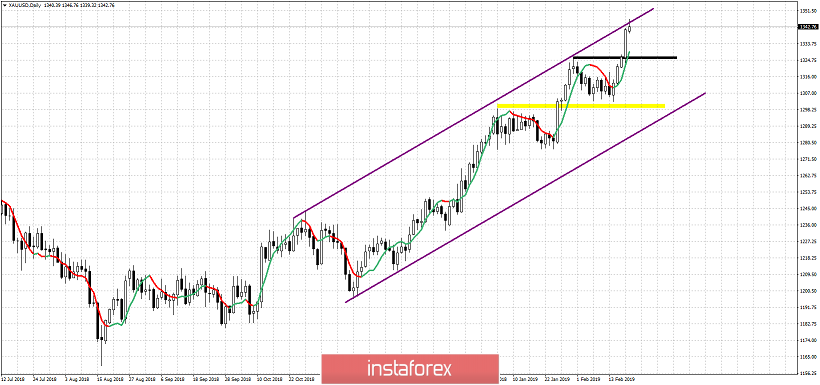
Yellow rectangle- major support area
Black rectangle - short-term resistance (broken) now support
Gold price has reached our $1,330-40 target area and the upper channel boundary. Gold price has reached its maximum short-term potential according to my view and at current levels I prefer to be neutral. Support is found at $1,326 and next and most important at $1,300. Medium-term trend remains bullish as long as we trade above $1,300. However I expect at least a short-term reversal towards $1,330 to be seen this week. The Daily RSI (not shown above) is providing bearish divergence signs. This is an important warning for bulls.


