Main Quotes Calendar Forum
flag

FX.co ★ Technical Analysis of Intraday Price Movement of Nasdaq 100 Index, Thursday October 12, 2023.

parent
Forex Analysis:::2023-10-12T11:04:12

Technical Analysis of Intraday Price Movement of Nasdaq 100 Index, Thursday October 12, 2023.

Technical Analysis of Intraday Price Movement of Nasdaq 100 Index, Thursday October 12, 2023.

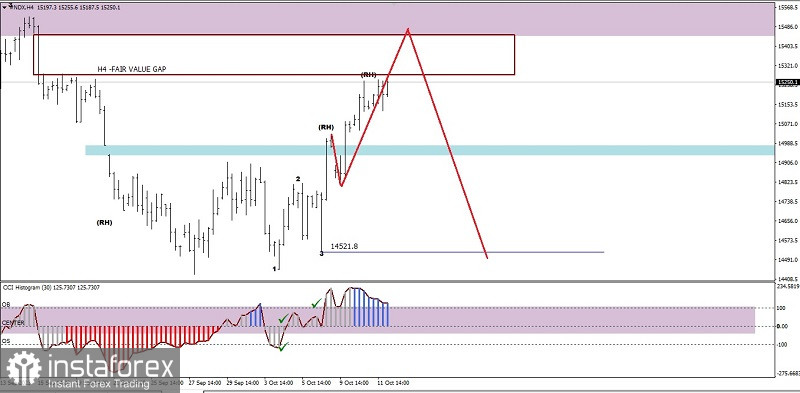
If we look on the 4 hour chart of Nasdaq 100 there is the appearance of bullish 123 pattern followed by Bullish Ross Hook (RH) as well as supported by CCI indicator which manages to break above its main three levels, then the probability of #NDX for rally upward is quite big where the level 15285,1 will be the main purpose target to break above. If this level successfully broken, then level 15530,2 will be the next target to be addressed in the near future, but everything will cancel itself if on the way to those levels suddenly #NDX corrected down to the level 14833,8.

(Disclaimer)

Analyst InstaForex
Share this article:
parent
loader...
all-was_read__icon
You have watched all the best publications
presently.
We are already looking for something interesting for you...
all-was_read__star
Recently published:
loader...
More recent publications...