


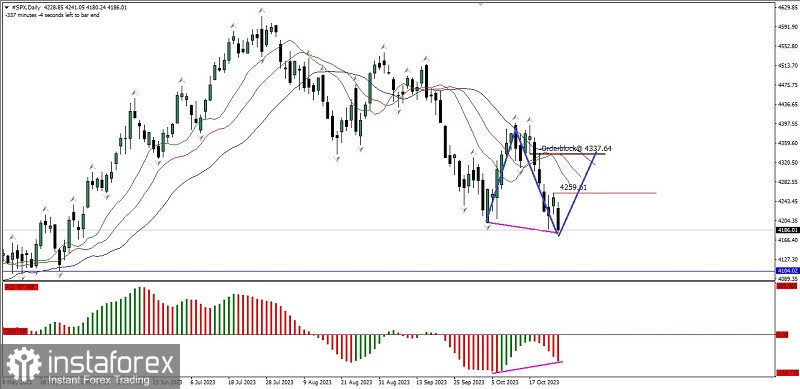
Even though on the daily chart the S&P 500 index is weakening, which is indicated by the Alligator opening its mouth downwards, the appearance of deviations between price movements and the Awesome Oscillator indicator provides an opportunity for upward correction, where currently #SPX is trying to breaks above the 4259.61 level. If this level is successfully broken upwards, the next level that will be aimed at is 4337.64, provided that during its journey towards the target levels, #SPX does not return to its original bias and breaks below the 4104.02 level because if this level is successfully broken, the upward correction scenario that has been described will become invalid.
(Disclaimer)


