


Technical outlook:
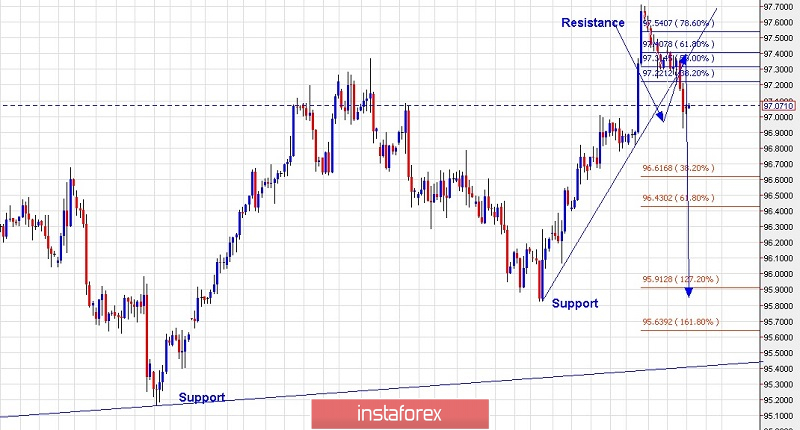
The 4H chart of US Dollar Index is presented for a medium-term outlook for price action and wave counts. It is clearly visible that the US Dollar Index has broken below its immediate line of support and has hit new lows below the 97.00 mark. A pullback can be expected towards the 97.40/50 levels which is also Fibonacci 0.618 resistance of the recent drop between 97.71.00 through the 96.90 levels, respectively. A bearish reversal from there could drag the prices lower towards the levels of 95.90 and 95.60, respectively, which also breaks the price support at the 95.82 levels as shown here. Please note that all the above is an aggressive trade setup that seems to be probable at these times, and if the wave structure unfolds as described above, the US Dollar Index might form a meaningful top at the 97.71 levels and could decline towards at least the 94.00 levels or even lower.
Trading plan:
Aggressive traders should go short around the 97.40/50 levels with a stop at 97.75 and the target of 95.50.
Good luck!


