Technical Market Overview:
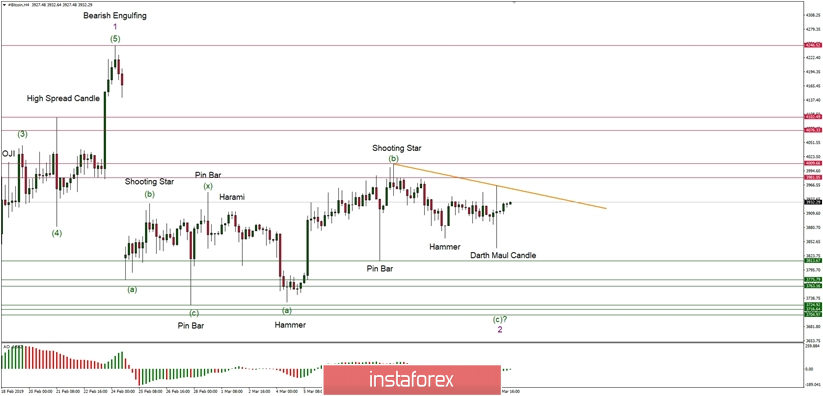
The BTC/USD pair has made a very interesting candlestick on the H4 time frame chart. It looks like a Dart Maul lightsaber, which is why I called it that way. This candlestick indicates indecision of market participants and a lack of a movement in either direction. Neither bulls not bears have decided yet what way to move: up or down. This is why the candlestick has closed in the middle of the range. The horizontal correction continues, but please remember there is still wave (c) of the wave 2 to be made in order to complete the correction.
Weekly Pivot Points:
WR3 - $4,374
WR2 - $4,179
WR1 - $4,091
Weekly Pivot - $3,907
WS1 - $3,816
WS2 - $3,625
WS3 - $3,539
Trading Recommendations:
Please keep an eye on the market reaction to the trendline test and trade accordingly. The protective stop-loss orders for the long-term traders should be placed at $4,010 level as any violation of this level will invalidate the short-term bearish outlook. The short-term traders or daytraders should place the protective stop-loss orders above the level of $3,951 if they are on the sell side of the market. The potential wave (c) should be a form of an impulsive wave, so it will be a sudden and quick wave down (it even might be a spike down), so please be prepared.