


Gold price is trading around important pivot level of $1,300. As long as price is above it there are many chances we see another run higher towards $1,322. Staying below $1,300 will open the way for another sell off towards $1,250.
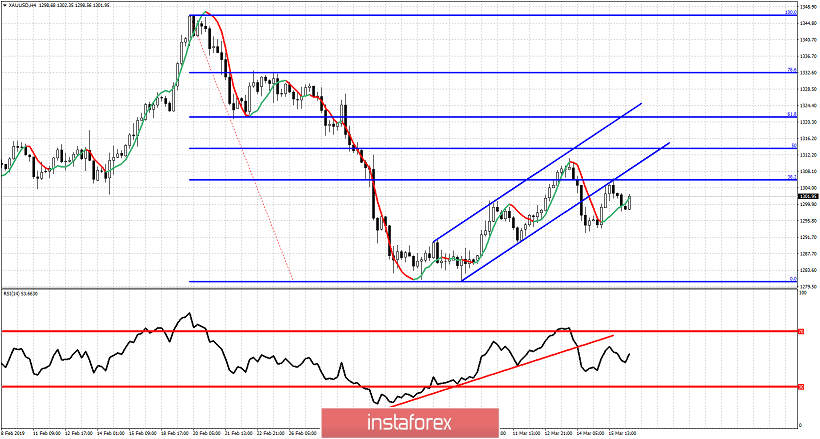
Red line - RSI support trend line
Gold price broke out and below the bullish channel. This is the first reversal sign. Price bounced back up towards the lower channel boundary and got rejected. This is the second bearish sign. The RSI broke the support trend line. This is the third bearish sign. However, all these are for now just warnings of another sell-off to come. To confirm this bearish scenario bears need to see more signs of weakness. Support is at $1,292 and next at $1,280. Resistance is at $1,312. Bears need to see $1,292 fail to hold for a push towards the major support at $1,280. Breaking below $1,292 will increase dramatically the chances of breaking below $1,280 for a move towards $1,250-60. Breaking above $1,312 will open the way for a move towards $1,322-32.


