


GBP/USD has been trading sideways at the price of 1.3270. Support level at the price of 1.3250 is on the test.
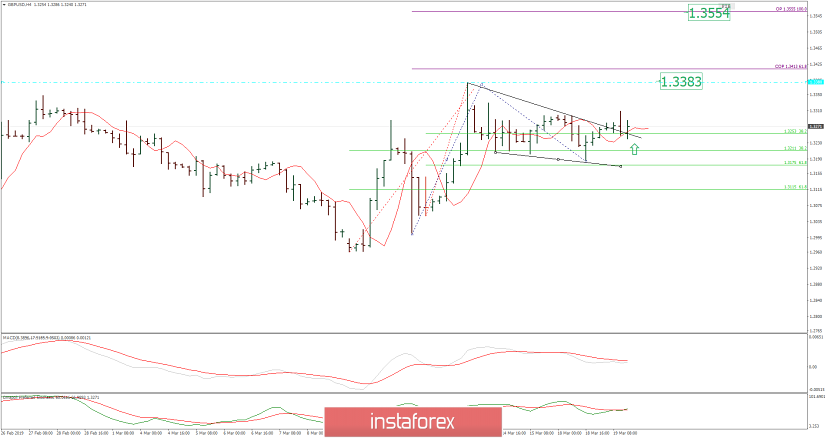
According to the H4 timeframe, we have found that GBP/USD found support at the price of 1.3253 (Fibonacci retracement 38.2%), which is a sign that selling GBP/USD at this stage looks risky. Fibonacci confluence is found at 1.3210-1.3175. Resistance levels were seen at 1.3385 and 1.3554. MACD oscillator is ready for a bullish cross which suggests a potential bullish movement.
Trading recommendation: We are long GBP from 1.3266 and with protective stop at 1.3160 and the main target at 1.3550.


