


Gold price made a marginal new higher high and reached $1,324.50 but is now pulling back lower again in early Tuesday trading. Gold price is challenging important Fibonacci resistance area and the RSI has given a new higher high relative to the last high. This implies increased chances of more upside for Gold.
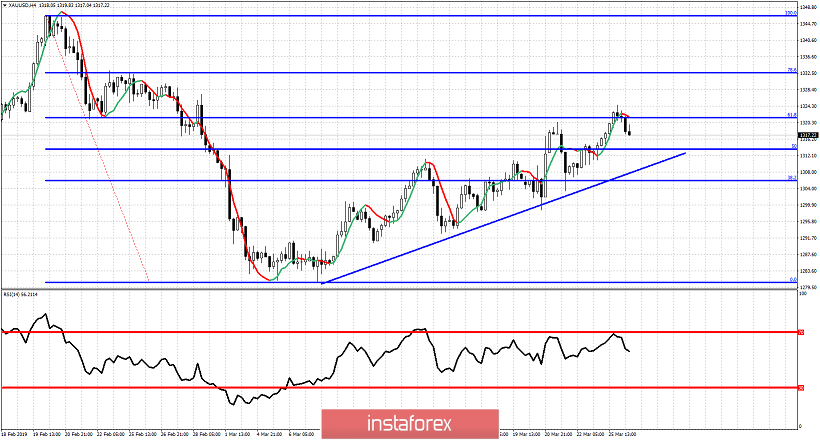
Gold price continues to trade in a bullish trend making higher highs and higher lows. Gold approached the 61.8% Fibonacci retracement providing a bearish divergence but with yesterday's new higher high the RSI made a new high. This strengthens the bullish scenario for a move towards $1,350-60. Gold price has support at $1,310-$1,300 and as long as price is above the blue trend line support I expect Gold to continue its move higher towards $1,350-60. Next resistance is at $1,333. Breaking above it will strengthen the bullish scenario.


