Main Quotes Calendar Forum
flag

FX.co ★ Technical Analysis of Daily Price Movement Nasdaq 100 Index,Thursday November 16, 2023.

parent
Forex Analysis:::2023-11-16T07:55:00

Technical Analysis of Daily Price Movement Nasdaq 100 Index,Thursday November 16, 2023.

Technical Analysis of Daily Price Movement Nasdaq 100 Index,Thursday November 16, 2023.

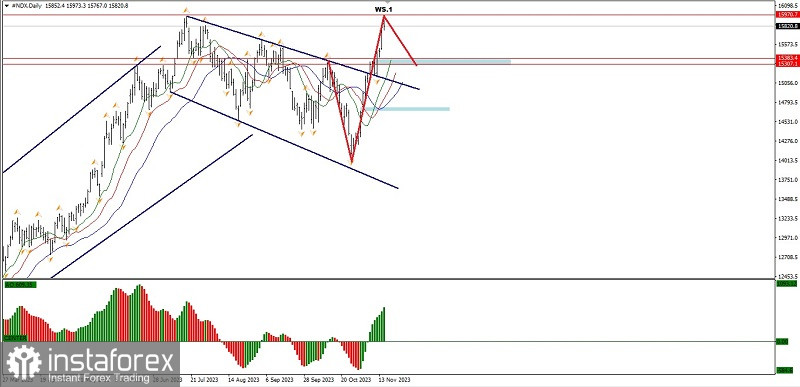
It can be seen on the daily chart of the Nasdaq 100 index that there is a Bullish Continuation Bull Flag pattern which was successfully broken out and penetrated upwards, but with the emergence of the Wiseman 1 Bearish Divergent bar on EUR/GBP, it gives an indication of the existence of a Turning Point pattern on EUR/GBP so as long as it doesn't happen it will strengthen again and break through. above the level of 15970.7 EUR/GBP has the potential to fall down to the level of the 15383.4-15307.1 area.

(Disclaimer)

Analyst InstaForex
Share this article:
parent
loader...
all-was_read__icon
You have watched all the best publications
presently.
We are already looking for something interesting for you...
all-was_read__star
Recently published:
loader...
More recent publications...