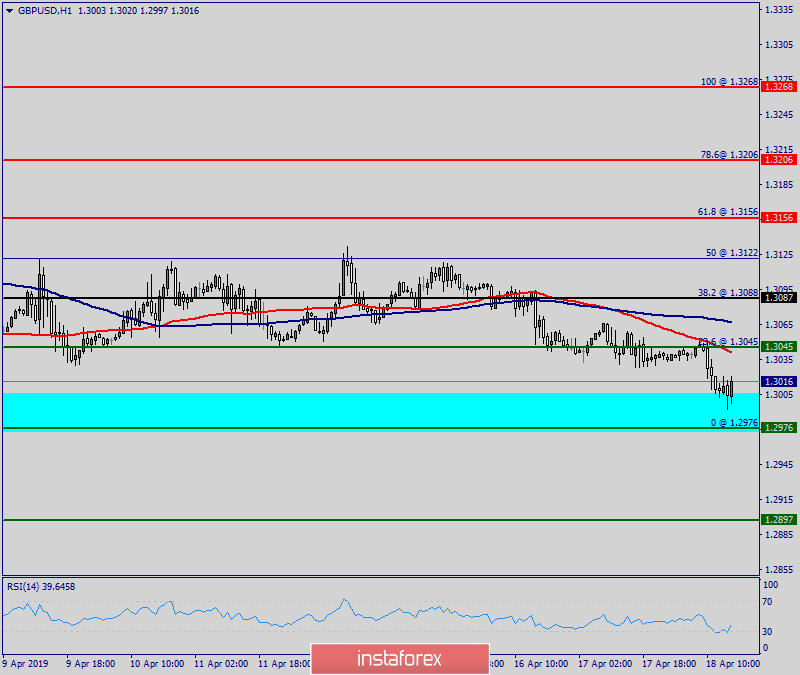
Overview: The GBP/USD pair continues to move upwards from the level of 1.3087. Last week, the pair rose from the level of 1.3087 to a top around 1.3201 but it rebounded to set around the spot of 1.3140. Today, the first resistance level is seen at 1.3206 followed by 1.3268 , while daily support 1 is seen at 1.3087 (38.2% Fibonacci retracement). According to the previous events, the GBP/USD pair is still moving between the levels of 1.3087 and 1.3268; so we expect a range of 181 pips in coming days. Furthermore, if the trend is able to break out through the first resistance level at 1.3206, we should see the pair climbing towards the double top (1.3268) to test it. Therefore, buy above the level of 1.3087 with the first target at 1.3206 in order to test the daily resistance 1 and further to 1.3268. Also, it might be noted that the level of 1.3268 is a good place to take profit because it will form a double top. On the other hand, in case a reversal takes place and the GBP/USD pair breaks through the support level of 1.3087, a further decline to 1.2976 can occur which would indicate a bearish market.


