


Gold price has given us bullish signals the last couple of trading days of the past week. First short-term resistance at $1,288 was broken and now we have price back above $1,300 breaking important trend lines resistance. Holding above $1,300 and specially $1,290 is key for the bullish scenario.
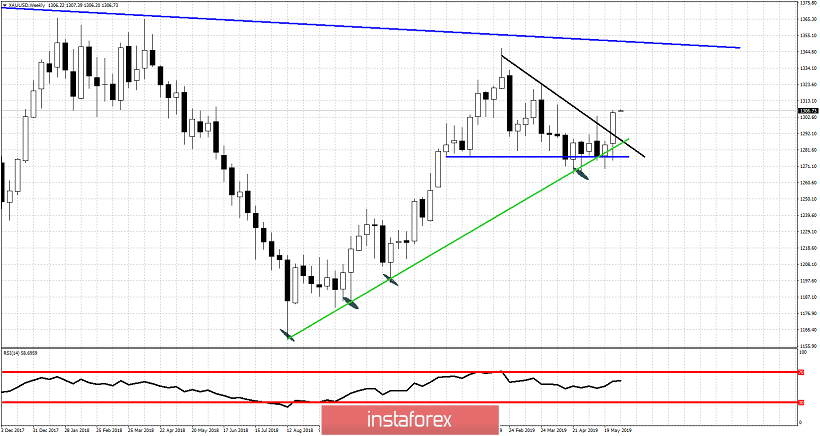
Blue horizontal line -neckline support
Black line - important resistance trend line
Blue downward sloping line - major resistance trend line
Gold price although initially broke below the Green support trend line, it did not close below it. This was the first bullish sign implying bulls continue to support Gold at $1,270-80 area. Bears were not strong enough to break through. Resistance at $1,290-$1,300 was tested several times and last week we saw Gold price close above $1,300. It is important for bulls to continue to see price above $1,300. This will lead to a move to $1,350. Another failure to hold $1,300-$1,290 would be a bearish sign.


