


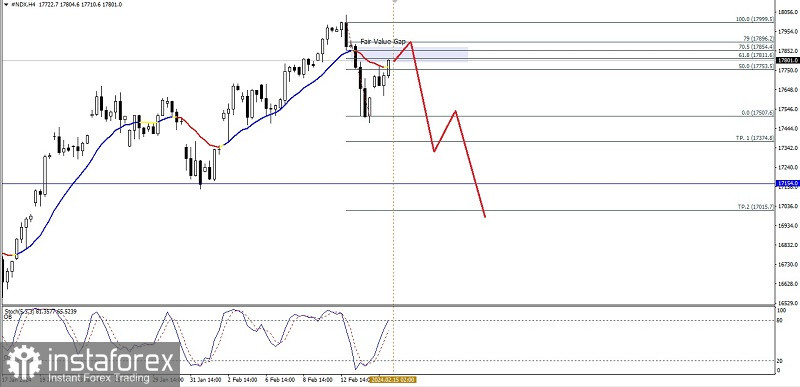
If we look at the 4-hour chart of the Nasdaq 100 index, it can be seen that the Stochastic Oscillator indicator is approaching entering the Overbought region and WMA 20 has a downward slope and at the same time the #NDX price movement is being stuck at the level of the Bearish Fair Value Gap area (pink box) so that in the near future as long as #NDX does not continue its strengthening until it breaks above level 17886.0 then #NDX has the opportunity to weaken down to level 17507.6. If this level is successfully breaks below then #NDX has the opportunity to weaken again to level 17374.8 as its first target and level 17154.0 as the next target to be aimed at.
(Disclaimer)


