


On March 29, a visit towards the price levels of 1.2980 (the lower limit of the newly-established bearish movement channel) could bring the GBPUSD pair again towards the upper limit of the minor bearish channel around (1.3160-1.3180).
Since then, Short-term outlook has turned into bearish with intermediate-term bearish targets projected towards 1.2900 and 1.2850.
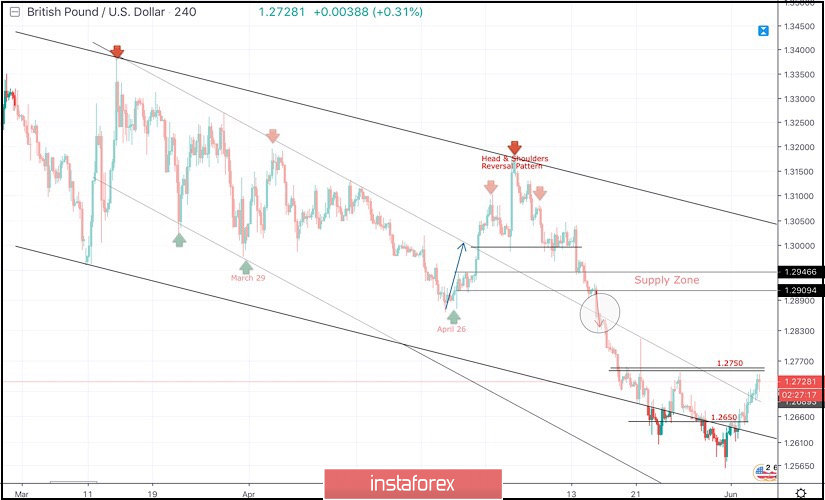
On April 26, another bullish pullback was initiated towards the price zone of 1.3130-1.3170 where the depicted bearish Head and Shoulders reversal pattern was demonstrated on the H4 chart with neckline located around 1.2980-1.3020.
Hence, Bearish breakdown below 1.2980 allowed the recent significant bearish movement to occur.
Initial bearish Targets were already reached around 1.2900-1.2870 (the backside of the broken channel) which failed to provide any bullish support for the GBPUSD pair.
Further bearish decline was demonstrated towards the lower limit of the long-term channel around (1.2700-1.2650) where the GBPUSD pair looked oversold obviously.
That's why conservative traders were suggested NOT to consider any SELL signals around those low price levels.
As anticipated, bullish breakout above 1.2650 has already been achieved. This enhanced the bullish side of the market towards 1.2750.
For the bulls to remain dominant, another bullish breakout above 1.2750 is needed to extend potential bullish targets towards 1.2800 then 1.2890 if sufficient bullish momentum is demonstrated. Otherwise, another bearish visit towards 1.2650 shouldn't be excluded.
Trade Recommendations:
For Intraday traders, a valid BUY entry was suggested around 1.2650. T/P level to be located around 1.2720 and 1.2820. S/L should be advanced to 1.2680 to secure more profits.
Conservative traders should wait for an extensive bullish pullback towards 1.2870-1.2905 (newly-established supply zone) to look for valid sell entries. S/L should be placed above 1.2950.


