


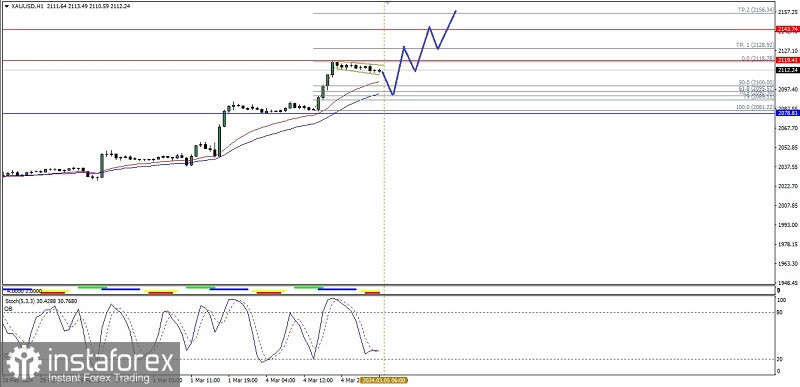
On the 1 hour chart of the Gold commodity asset, we can see that the condition of Gold is currently being dominated by buyers. This can be seen from the Golden Cross between EMA 21 and EMA 34 and the appearance of the Descending Broadening Wedge pattern which further confirms that today's bias for gold is stronger, but If there is a weakening correction to get its strengthening momentum back as long as it doesn't weaken down below the 2078.81 level then Gold will return to its initial bias (Bull) where this commodity asset will try to break above the 2119.41 level and if this level is successfully broken above then the 2143.74 level will be the main target Even if the momentum and volatility support it, it is not impossible that Gold today will go to the level of 2156.34.
(Disclaimer)


