


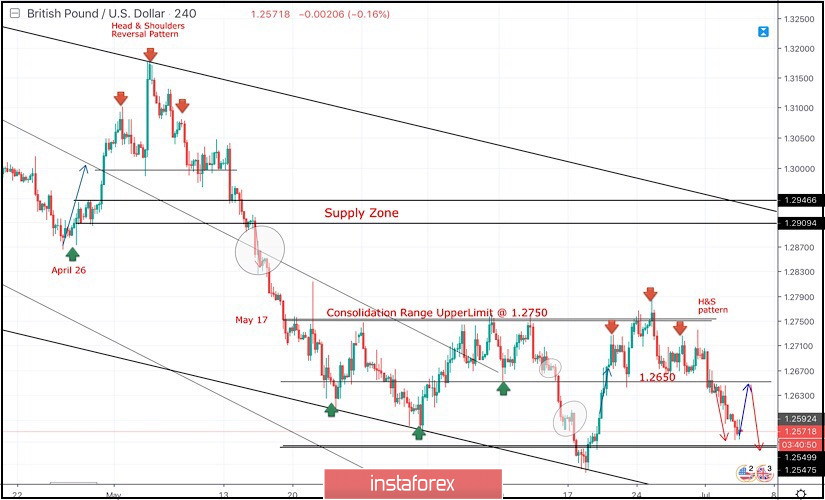
Since May 17, the previous downside movement within the depicted bearish channel came to a pause allowing the recent sideway consolidation range to be established between 1.2750 - 1.2550 with a prominent key-level around 1.2650.
On June 4, temporary bullish consolidations above 1.2650 were demonstrated for a few trading sessions. However, the price level of 1.2750 (consolidation range upper limit) has prevented further bullish advancement.
That's why, the GBP/USD failed to establish a successful bullish breakout above 1.2750. Instead, early signs of bearish rejection have been manifested (Head & Shoulders reversal pattern with neckline located around 1.2650).
A quick bearish pullback towards 1.2650 was expected shortly.
Bearish breakdown below 1.2650 (reversal pattern neckline) confirms the reversal pattern with bearish projection target located at 1.2550 and 1.2510.
Short-term outlook remains under bearish pressure as long as the market keeps moving below 1.2650 (mid-range key-level and neckline of the reversal pattern).
In general, Obvious Bearish breakdown below 1.2570 confirms a trend reversal into bearish on the intermediate term. Immediate bearish decline would be expected towards 1.2505 initially.
Any bullish pullback towards 1.2650 should be considered as a valid SELL signal for Intraday traders.
On the other hand, a bullish position can ONLY be considered if EARLY Bullish persistence above 1.2650 is re-achieved on the current H4 chart.
Trade Recommendations:
Intraday traders can have a valid SELL Entry anywhere around the neckline of the depicted reversal pattern near 1.2650.
T/P levels to be located around 1.2600, 1.2550 and 1.2505.
S/L should be placed above 1.2700.


