USDCAD is in bearish trend in Ichimoku cloud terms as price continues to make lower lows and lower highs below the Kumo (cloud). Each time we see price touch the cloud in the 4 hour chart we see a rejection. Will we see another one at current levels?
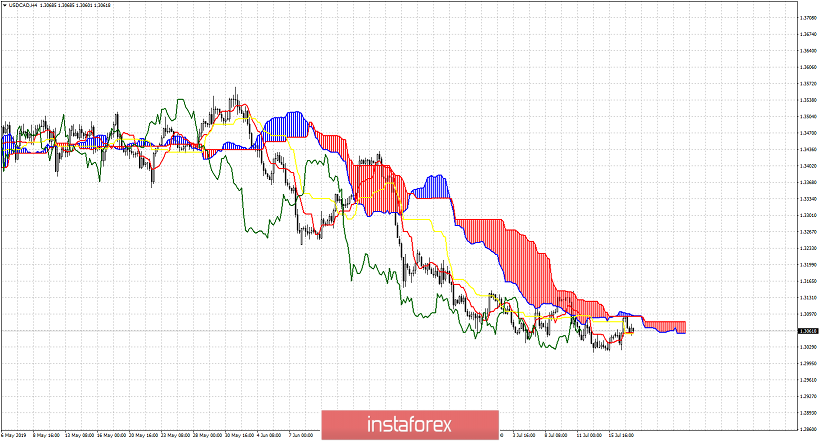
USDCAD is trading right on top of the tenkan- and kijun-sen indicators (red and yellow lines respectively). Trend is bearish as long as price is below the cloud. Price has tested the resistance at 1.3093 but got rejected. Support is here at 1.3055 and a 4 hour close below it could lead to new lows below 1.30. Breaking above the cloud would be a short-term bullish sign that could lead price to 1.3170. The RSI is also giving bullish divergence warning signs (not shown above) and this is another reason why bears should be very cautious.


