


EUR/USD traded lower after the FOMC statement yesterday but it found a good support at the price of 1.1028 and there is potential for the upside movement in the next period.
Technical picture:
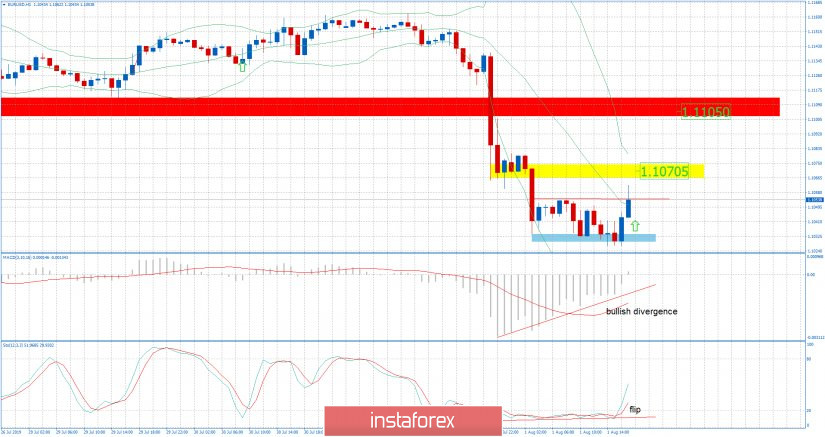
On the 1H time-frame I found that there is completed double bottom pattern, which is sign that buyers reacted on the EUR priced "too low".
Botch Stochastic and MACD oscillators are showing the oversold condition and the bullish divergence, which is clear sign that there is decreasing in the bearish momentum.
Important upward references:
1.1070 yellow rectangle– Balance range resistance
1.1105 red rectangle– Swing low acting like resistance
Important downward references:
1.1028 blue rectangle –Defined support cluster
1.1100 – Round number support
My advice is to watch for buying opportunities with the first target at the price of 1.1070.


